
13 SaaS SEO KPIs to Track Your Organic Growth
Organic growth in SaaS is about turning that traffic into trials, users, and revenue. That’s where SEO KPIs come in. These are measurable indicators that show how well your website performs across visibility, engagement, and conversions. Instead of guessing what works, SaaS teams use KPIs to connect content and technical SEO efforts directly to business outcomes.
Tracking the right KPIs matters because organic search is a long-term growth channel. According to HubSpot, 75% of users never scroll past the first page of search results. That means visibility alone can determine whether your product gets discovered or ignored. But rankings are only one piece; without tracking engagement and conversions, you won’t know if that visibility actually drives revenue.
This guide breaks down 13 SaaS SEO KPIs that help you measure what truly matters. From impressions and keyword rankings to activation rates and ROI, these metrics give you a clear view of where growth is happening, where it’s stalling, and what to optimize next.

Key Takeaways
- Focus on a core set of metrics that show real impact on site growth.
- Use Google Search Console as the primary source for visibility data.
- Measure both engagement (bounce, pages per session) and outcomes (conversions).
- Track changes over time to link actions to improved rankings and traffic.
- Regular reporting helps marketing teams optimize content and tools for better results.
What Are the SaaS SEO KPIs
Well-chosen indicators help teams tie website performance to real business outcomes. Start by picking measures that reflect both user behavior and commercial goals. That clarity makes work easier to prioritize and easier to justify.
Defining Success Metrics
Define what “winning” looks like for your site. Look at how content feeds the funnel and which pages lead to trials or signups. Use measurable metrics so teams make decisions from data, not opinion.
Aligning Metrics with Strategy
Match each metric to a marketing or product objective. Track visibility, engagement, and conversions so every piece of content serves a purpose.
- Set clear benchmarks for traffic and conversion rates.
- Use regular reviews to spot pages that need work.
- Focus on what improves search visibility and user value.
Tip: Treat KPIs as guideposts. They reveal weak spots and help you refine both content and technical work.
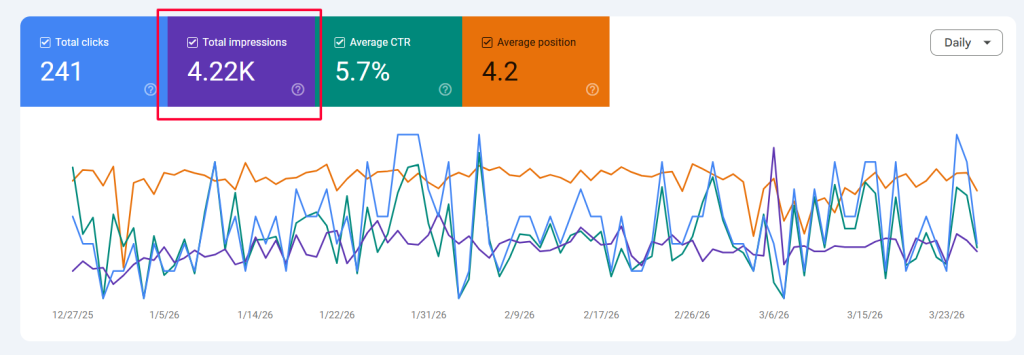
Measuring Search Impressions
Watching impression counts helps teams spot increases in visibility before traffic rises.
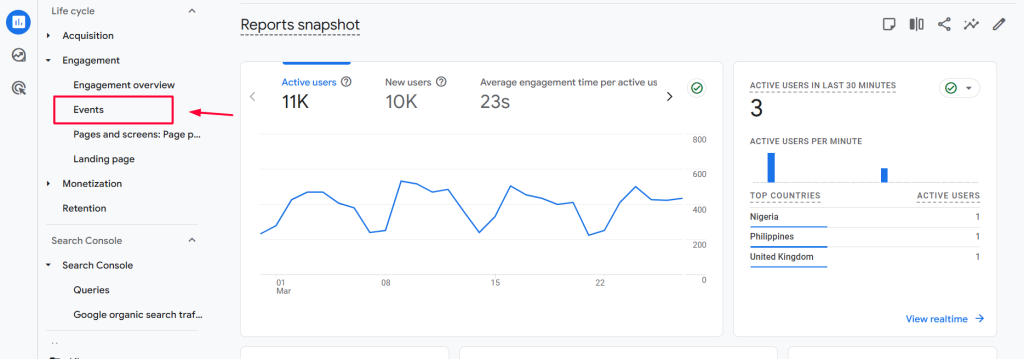
Search impressions represent the total number of times your website appears in search results, even when no one clicks. Use Google Search Console as the primary source to track this number and other visibility data.
Compare impressions with organic traffic and page performance to find pages that get seen but underperform on clicks. This helps you test titles, meta descriptions, and content to improve the click-through rate and user experience.
- Monitor month-over-month trends to set a baseline for growth.
- Use impression spikes as an early signal to investigate ranking or content changes.
- Pair impression data with conversions to measure business impact.
| Metric | What it shows | Action |
| Impressions | How often pages appear in search | Optimize titles and snippets to lift CTR |
| Clicks | Visitors who reached your site from search | Improve content relevance and landing pages |
| CTR | Click rate vs impressions | Test messaging and meta tags |
| Conversions | Business outcomes from search visitors | Align pages to marketing and product goals |
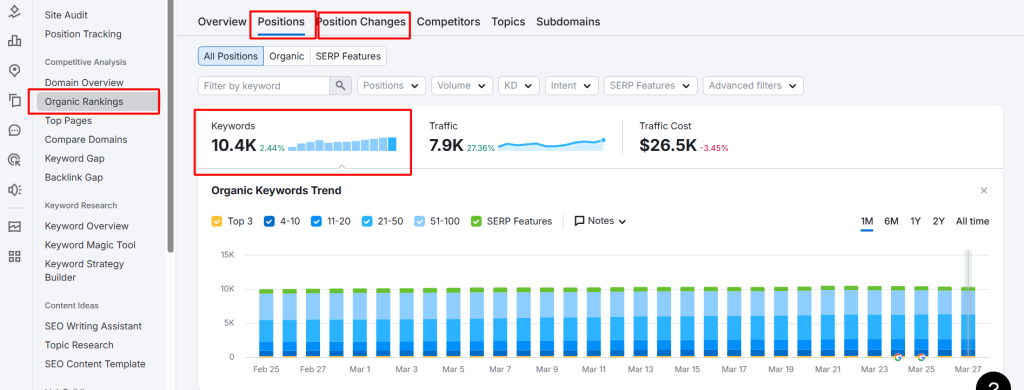
Tracking Keyword Rankings
Monitoring how your keywords rank over time reveals which content and pages actually win in search results. Tracking ranking positions gives a clear signal about visibility and performance for target terms.
Semantic Search Impact
Modern search understands intent, so a single page can rank for many related queries. That means one well-optimized page often drives traffic for multiple search contexts.
Use tools like Ahrefs and SEMrush to pull historical ranking data. These tools help you spot front-page movement and sudden drops so you can act quickly.
- Watch the top three positions; they attract the most clicks from users.
- Assess which pages rank for clusters of keywords and expand content where needed.
- Combine ranking data with conversions to judge real business impact.
| Metric | What it shows | Action |
| Position history | Trends over time | Investigate recent content or algorithm changes |
| Keyword clusters | Semantic reach of a page | Broaden content and internal links |
| Front-page count | Number of target terms on page 1 | Prioritize pages to push into top results |
Consistent tracking turns raw ranking numbers into an actionable report. That helps marketing teams improve site authority and sustain organic growth.
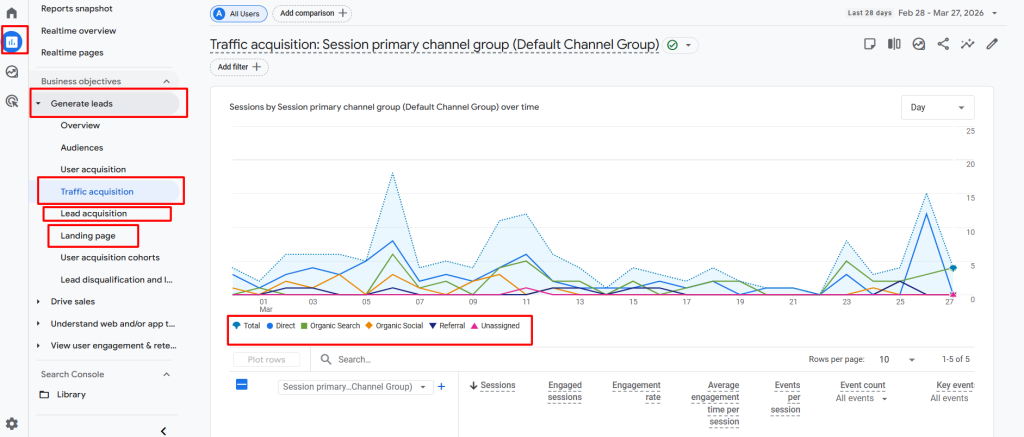
Analyzing Organic Traffic
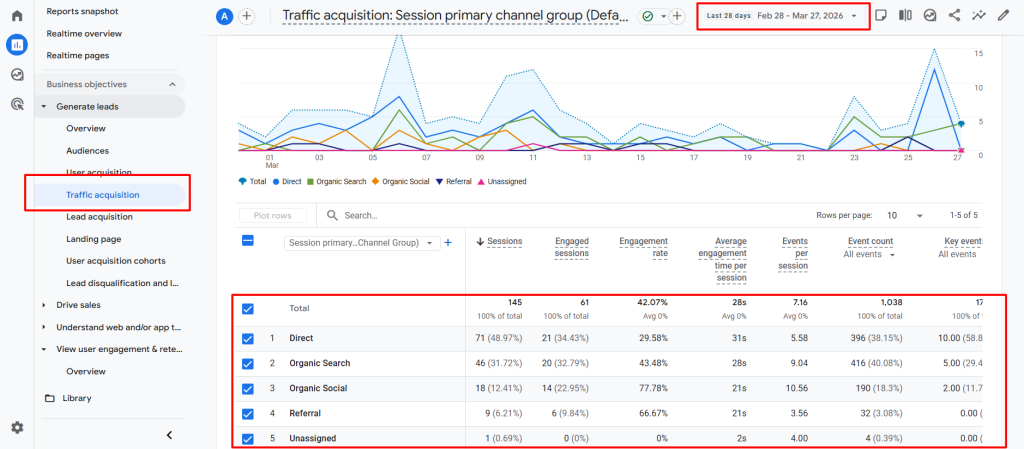
Tracking the flow of unpaid visitors helps teams spot which pages deliver lasting value. Use Google Analytics 4 as the standard tool to segment organic traffic by landing page and device. That view shows where users arrive and how they behave.
Growth in organic traffic signals that your content and marketing strategy work. Sudden drops often indicate technical issues or loss of rankings and deserve immediate review.
Segment data to find opportunities. Look at top landing pages, mobile vs. desktop splits, and pages with strong impressions but low conversions. Those insights guide content updates and prioritization.
- Monitor month-over-month trends to confirm steady growth.
- Create content for gaps competitors miss to capture new visitors.
- Build topic clusters and update pages to boost visibility and long-term value.
| Metric | What it shows | Tool | Action |
| Organic traffic | Total non-paid visits | Google Analytics 4 | Prioritize high-performing landing pages |
| Device split | Mobile vs. desktop behavior | GA4 segments | Optimize pages and layouts per device |
| Landing page performance | Which pages attract visitors | GA4 reports | Update content and CTAs |
| Trend changes | Growth or sudden drops | GA4 + search console | Investigate technical or ranking issues |
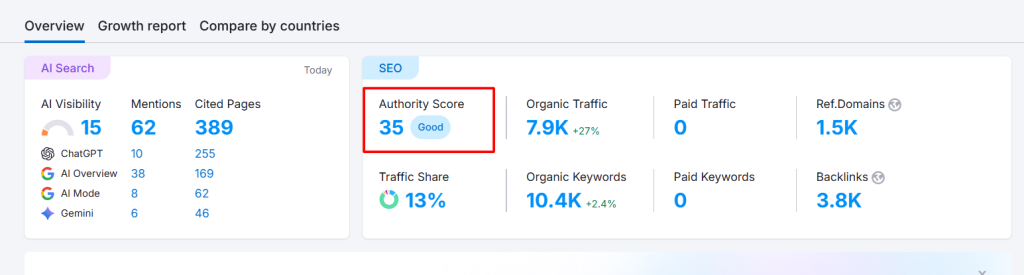
Evaluating Domain Strength
A website’s authority shapes its ability to rank for competitive queries and attract steady traffic.
Domain strength is a measure of your site’s overall authority and the likelihood it will rank for search queries. Industry tools like Moz, Ahrefs, and Semrush report popular scores that approximate this strength.
Backlink quality matters most. Links from authoritative sites act as votes for your content and speed recovery after algorithm updates. Publishing original research and useful data helps attract those links naturally.
- Monitor domain scores monthly to set benchmarks.
- Build a diverse link portfolio from trusted sources.
- Use competitive data to prioritize pages that need link support.
| Metric | What it measures | Why it matters | Quick action |
| Moz Domain Authority | Link profile strength and age | Shows competitive position | Gain links from niche authorities |
| Ahrefs Domain Rating | Backlink quality and quantity | Predicts ranking ease | Target high-value outreach |
| Semrush Authority Score | Composite site trust and traffic | Tracks long-term growth | Publish original studies to earn citations |
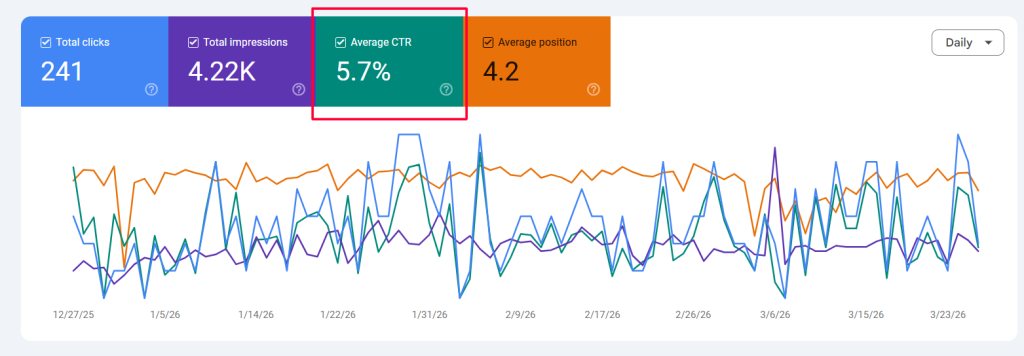
Monitoring Click Through Rate
CTR reveals whether your search listing turns visibility into actual visitors.
Click-through rate is the percentage of users who click your link after seeing it in search results. Calculate CTR by dividing clicks by impressions and multiplying by 100. This simple metric directly affects traffic and shows if your listing communicates value.
Use Google Search Console to pull CTR by page and query. Identify pages with high impressions but low clicks and test new meta titles and descriptions. Including the current year or a clear number in titles often improves the rate.
- Benchmark CTR against past performance to spot gains or losses in organic traffic.
- A higher CTR can act as a positive signal to search engines and may help rankings over time.
- Optimizing snippets is a fast way to lift visitors without changing keyword positions.
| Metric | What to check | Quick action |
| CTR (%) | Clicks ÷ impressions × 100 | Test titles, update meta descriptions |
| Top pages | Pages with many impressions but low clicks | Rewrite snippet to clarify value |
| Trend | Month-over-month change in rate | Benchmark and repeat successful tests |
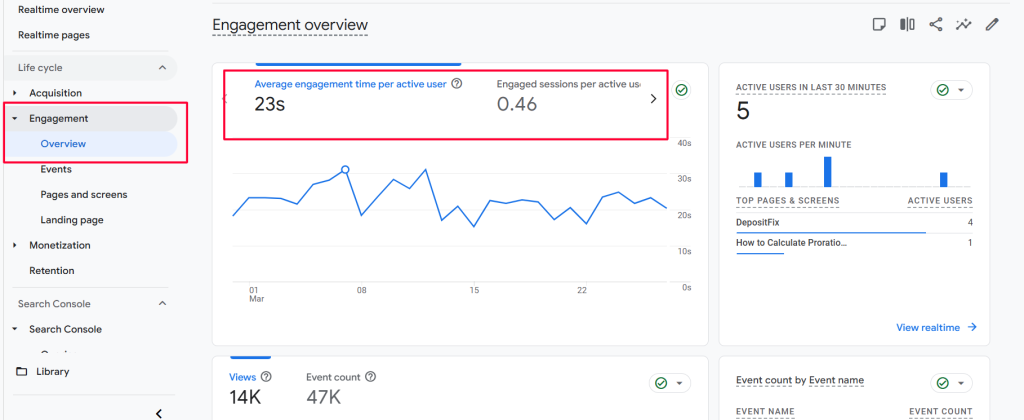
Assessing Time on Page
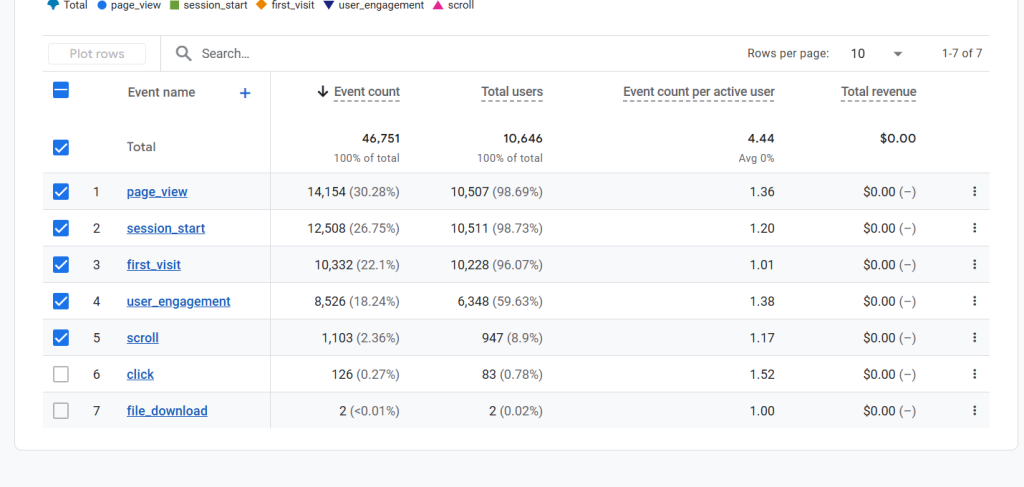
Average engagement time shows how actively visitors interact with a page, not just how long it sits open. Google Analytics 4 reports this metric to give a clearer view of real user attention.
Time on page is a key metric that indicates whether your content delivers value. Longer engagement usually means pages answer user questions and keep visitors exploring your site.
To lift engagement, structure content with clear headings and short paragraphs. Add embedded video, interactive tools, or quick quizzes to make pages more compelling.
- Measure: Use GA4’s Average engagement time per page to compare formats and topics.
- Improve: Enhance scannability, add visual aids, and reduce load time to keep users longer.
- Align: Match expected time with content intent — a tutorial should aim for more minutes than a quick FAQ.
Consistent tracking of time on page helps marketing and product teams refine content strategy. Higher engagement often correlates with better conversion rates and stronger search visibility, so treat this metric as a practical guide for growth.
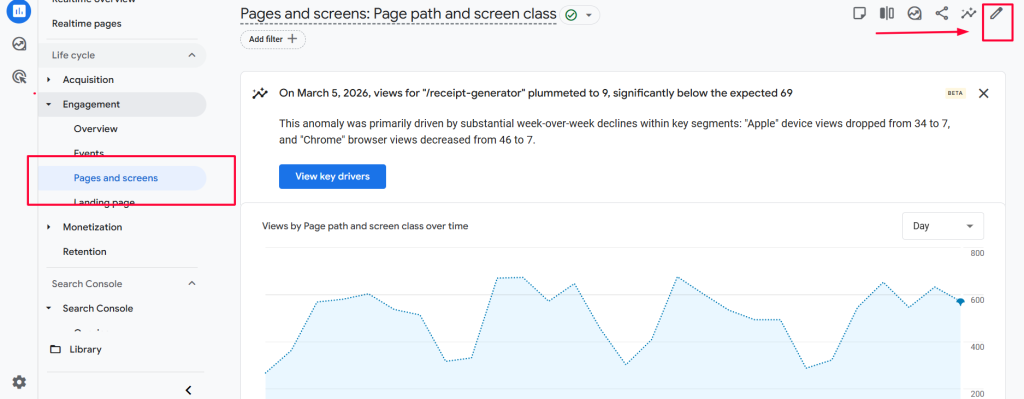
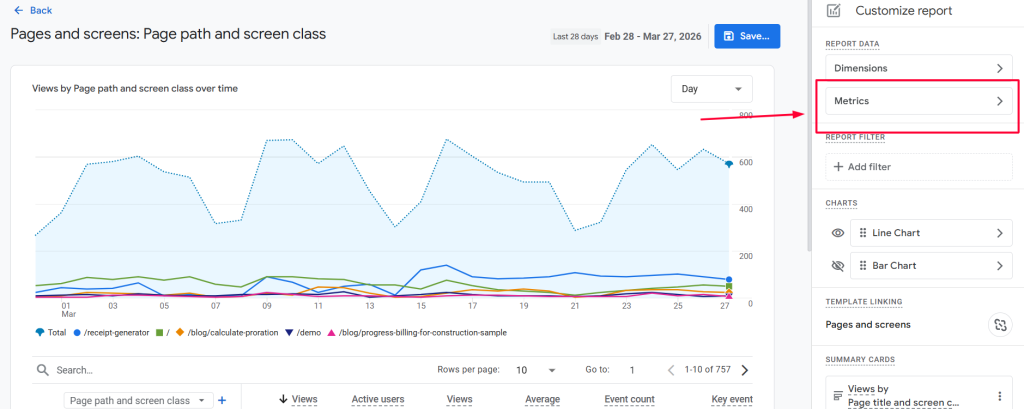
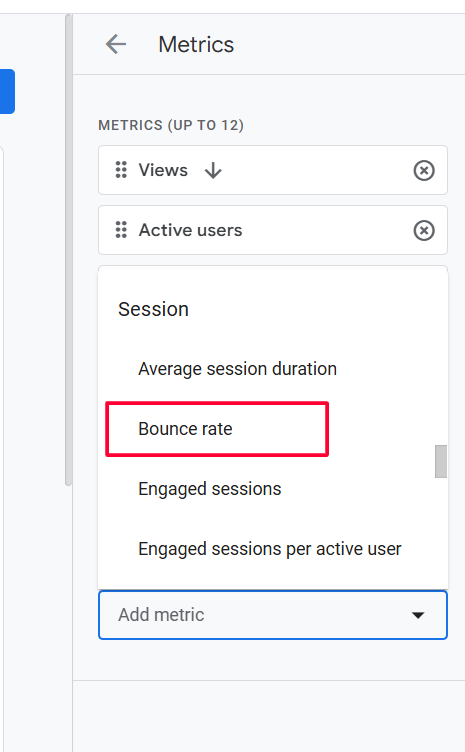
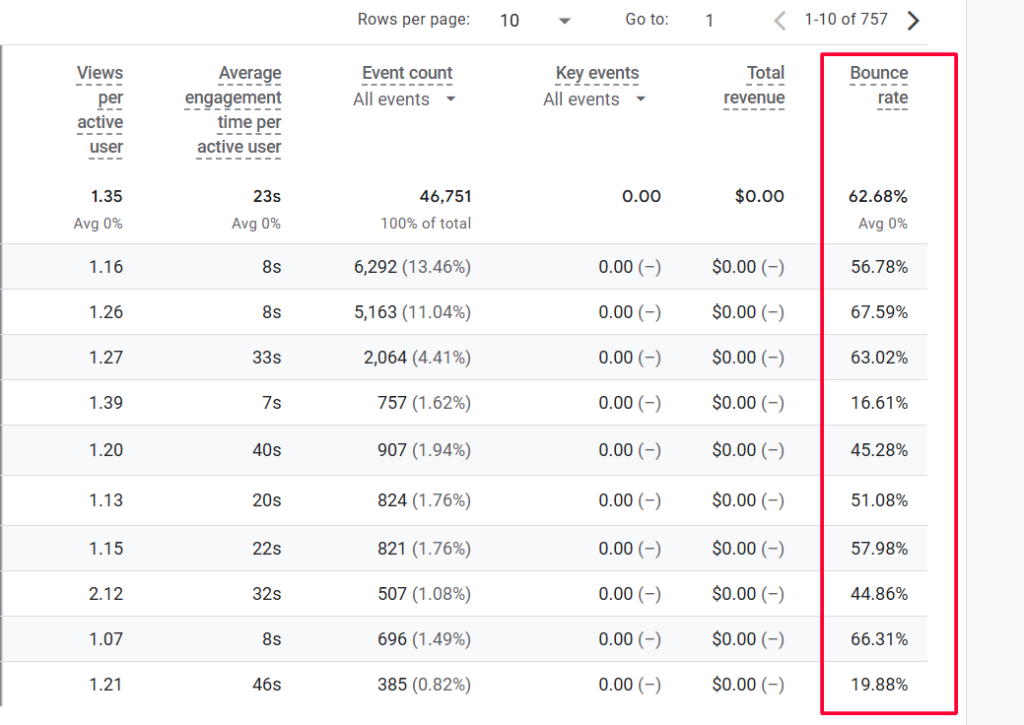
Reducing Bounce Rate
Lowering the bounce rate starts with making the first few seconds on a page count. Fast load time, clear headings, and a promise that matches your title and meta description keep visitors engaged.
Across industries the average bounce rate sits near 55%, so measure your pages against that baseline. Use Google Analytics 4 and add an “Engaged sessions” custom report to improve tracking and spot problem pages quickly.
Practical changes often move the needle. Optimize images and code to speed up mobile performance. Add relevant internal links within the first two paragraphs to invite clicks to other pages.
- Align content with search intent so users find what they expect.
- Test concise, benefit-driven meta descriptions and titles to boost traffic quality.
- Fix slow elements and prioritize above-the-fold clarity for better engagement.
| Metric | What it measures | Quick action |
| Bounce rate | Single-page exits as a percentage | Improve first screen and internal links |
| Engaged sessions | Active user time and interactions | Create GA4 report and compare pages |
| Page speed | Load time on devices | Compress images, defer scripts |
Monitor the rate regularly and prioritize pages with high traffic but low engagement. Small content edits and speed fixes often produce measurable growth in conversions and long-term visibility.
Tracking Organic Conversions
Measuring conversions from organic traffic reveals which pages actually drive value.
Organic conversions count visitors from search engines who complete desired actions, like signups or purchases. Use Google Analytics 4 to define events as conversions so you can tie organic traffic to revenue and leads.
Map content to stages in the buyer journey. That makes it easier to place calls to action where intent is highest and lift conversion rate over time.
- Track micro-conversions (newsletter signups) and macro-conversions (paid orders).
- Prioritize pages that deliver the most conversions and focus optimization there.
- Review conversion numbers regularly to justify marketing spend and show growth.
Tip: Improving conversion rate often beats chasing more traffic because it has a direct effect on revenue and business performance.
| Metric | What it shows | Action | Tool |
| Organic conversions | Number of goal completions from search | Audit top-converting pages and replicate patterns | Google Analytics 4 |
| Conversion rate | Percent of visitors who convert | Test CTAs and align content with intent | GA4 experiments, landing page tests |
| Revenue per visitor | Revenue attributed to organic users | Prioritize content that drives higher value | GA4 + ecommerce tracking |
| Micro vs macro | Full funnel activity | Track both to understand user paths | GA4 event tracking |
Calculating Return on Investment
Knowing the economics behind organic traffic lets you prioritize pages that actually pay off.
Return on Investment (ROI) shows how much revenue your organic efforts create compared to what you spend. Use the simple formula: (Revenue from organic search – Cost of SEO) ÷ Cost of SEO × 100% to get a clear rate.
Benchmark performance. A strong marketing ROI is often around 5:1, meaning $5 earned for every $1 spent. Compare your rate to historical results and other marketing channels to see where your website and content deliver the most value.
- Focus keyword research on terms with clear purchase intent to lift conversion and revenue.
- Add conversion points across the site—ebooks, trials, and gated resources capture more leads.
- Use tracking tools to tie page performance and traffic back to actual business outcomes.
| Metric | What to measure | Action |
| Revenue from organic | Dollar value attributed to search-driven users | Track per landing page and adjust CTAs |
| Cost of effort | Agency, tools, content, and time | Include hourly rates to capture true spend |
| ROI rate | Percent return on cost | Set targets and report monthly |
| Leads vs revenue | Number of leads and their value | Prioritize pages that produce high-quality leads |
Consistent monitoring turns ROI from a retrospective metric into a planning tool. Analyze results, reallocate budget toward high-performing pages, and show leadership how search investment drives sustainable growth.
Monitoring Monthly Unique Visitors
Knowing the number of unique visitors each month shows whether your top-of-funnel work reaches new people.
Monthly unique visitors is the number of different people who visit your website over a set month. This metric measures brand awareness and the reach of content and marketing campaigns.
Use tools like Google Analytics to track unique visitor counts and see where users arrive. In Google Analytics, add a “Secondary Dimension” and choose “Source” to learn which campaigns or search engines drive the most traffic.
- Track month-over-month changes to spot steady growth or plateaus.
- Distinguish visits from unique visits to avoid misleading totals.
- Double down on channels that send the most visitors and adjust spend when numbers stall.
Consistent monitoring lets you test content, refine funnels, and lower bounce rate by serving related pages that keep users engaged. A steady rise in unique visitors is a strong signal your website and marketing are working for the business.
| Metric | What it shows | Quick action |
| Monthly unique visitors | Distinct users per month | Audit top channels and expand winners |
| Source breakdown | Where visitors come from | Optimize campaigns and content for top sources |
| Visit vs unique | Repeat sessions vs new users | Adjust messaging to convert new arrivals |
Measuring Activation Rates
Activation rate shows how many trial users reach the “aha” moment and start using your core features.
Activations count the number of users who convert a trial into an active subscription by experiencing real product value. A simple formula calculates the rate: divide activated subscriptions by total trial signups and multiply by 100.
The industry average signup-to-trial activation sits near 4.7%, which you can use as a benchmark. A lower rate signals onboarding friction or unclear value during the trial period.
- Track activations by plan and channel with tools like Chargebee to spot high-performing sources.
- Use a welcome email sequence and milestone nudges to move signups toward activation quickly.
- Analyze where users drop off in time to fix onboarding, help content, or product flows.
| Metric | What it measures | Quick action |
| Activation rate | Percent of trials that activate | Improve onboarding and first-use guides |
| Time to activation | Average minutes or days to reach value | Shorten steps, add in-app tips |
| Activations by source | Which channels drive engaged users | Invest in high-converting acquisition |
Consistent tracking links activation improvements directly to revenue and long-term growth. A high activation rate indicates strong product-market fit and predicts better retention and higher lifetime value.
Analyzing Viral Coefficient
Word-of-mouth remains one of the most efficient engines of user growth for modern products.
The viral coefficient measures the number of new users generated by each existing user, often via referrals. Multiply your active users by the average referrals per user to get this number. Aim for a coefficient ≥ 1 to achieve self-sustaining growth.
Tracking this rate helps predict future growth and its effect on revenue and leads. Products that delight users drive more organic invites than those that rely only on incentives. Reducing the viral cycle time — the time it takes for one user to invite another — raises momentum quickly.
- Calculate referrals per user and update monthly.
- Correlate viral numbers with conversion and revenue trends.
- Improve product quality and shareable content to boost invites.
| Metric | What it shows | Quick action |
| Viral coefficient | New users per existing user | Optimize referral flow |
| Cycle time | Average days to invite | Shorten onboarding and prompts |
| Referral conversion | Percent of invites that convert | Test messaging and landing page |
Tip: Monitor this metric alongside product satisfaction to see how user happiness translates into measurable growth.
Assessing Sales Qualified Leads
Measuring how many marketing-qualified leads turn into sales-ready contacts shows whether your funnel actually feeds revenue.
Sales-qualified leads (SQLs) are prospects ready for direct sales outreach. Tracking the number of SQLs helps refine lead scoring and shortens the sales cycle.
Calculate the MQL to SQL conversion rate by dividing SQLs by MQLs. The average benchmark is about 13%, which teams should use to gauge alignment between marketing and sales.
- Define clear criteria so both teams agree which prospects qualify.
- Segment leads by source to see which channels deliver the best quality.
- Monitor conversion and revenue outcomes to prioritize high-performing campaigns.
| Metric | What it shows | Benchmark | Quick action |
| Number of SQLs | Volume of sales-ready prospects | Varies by business | Adjust scoring to increase qualified flow |
| MQL → SQL conversion | How well marketing pre-qualifies leads | 13% avg | Improve messaging and landing pages |
| SQL close rate | Sales performance on qualified leads | Track by rep | Coach reps and refine handoff |
Consistent monitoring of SQLs reveals whether marketing attracts the right prospects and which tools improve performance over time.
🚀 How Queen of Clicks Helps SaaS Businesses
Queen of Clicks helps companies turn their website into a predictable growth engine that drives measurable revenue. We combine targeted content work with technical fixes to lift search visibility and conversion performance. Below are the core ways we support product-led businesses and marketing teams.
Custom Strategies
We design tailored plans that match your product, users, and goals. Each strategy focuses on improving traffic quality, on-page relevance, and conversion pathways.
Outcomes: higher organic traffic, more qualified leads, and measurable revenue gains.
Data Driven Growth
Our team uses analytics and testing to find what works fast. We track page-level metrics and user journeys to reduce friction and speed up time to conversion.
Approach: audit, hypothesis, test, iterate — all tied to clear business targets and revenue outcomes.
Book Your Consultation
Ready to translate search exposure into real customers? Book a call to review your website, conversion flows, and growth plan. We’ll share specific next steps you can use right away.
- Custom SEO strategies: increase organic traffic and drive sustainable revenue growth.
- Data-driven optimization: ensure every page aligns with target users’ search intent.
- High-impact tactics: improve rankings and turn your website into a lead conversion engine.
- Expert analysis: track the right metrics and scale your business effectively.
- Book a consultation: discuss goals and get a prioritized roadmap for faster results.
Book your call now and take the first step toward transforming your website into a high-performing asset for your business.

Conclusion
Regularly watching core site metrics lets you spot small wins that compound into real momentum. Focus on a compact set of KPIs and review them across weeks and quarters. Short windows catch immediate issues; longer time frames reveal sustainable growth.
Track organic traffic, monitor bounce rate, and measure conversion outcomes. These figures show how content and product paths perform in search and on your site. Small lifts in traffic or conversion rate often lead to meaningful revenue gains over time.
Make it a habit to track SEO work, compare results, and test changes fast. Use clear goals for rate improvements and revenue impact so every update ties back to business value.
Consistent measurement is the path to lasting success. Prioritize ROI, iterate, and start tracking these metrics today to drive steady growth and higher revenue.
FAQs
What is the difference between SaaS SEO KPIs and general SEO metrics?
SaaS SEO KPIs go beyond basic traffic and rankings. They connect SEO performance directly to business outcomes like trial signups, activation rates, and revenue. While general SEO metrics focus on visibility, SaaS KPIs measure how organic traffic contributes to the full customer journey.
How often should SaaS companies review their SEO KPIs?
Most SaaS teams review KPIs monthly to track trends, but high-growth companies often monitor key metrics weekly. Regular reviews help catch drops early and allow faster optimization of content, rankings, and conversion paths.
Which SaaS SEO KPI is the most important to prioritize first?
There isn’t a single “most important” KPI, but organic conversions and conversion rate typically have the biggest impact on revenue. If you’re just starting, focus on traffic and rankings first, then shift toward conversion-focused metrics as you grow.
How do you connect SEO KPIs to revenue in SaaS?
To connect SEO to revenue, track conversions in tools like Google Analytics 4 and assign value to each action (trial, demo, purchase). This allows you to calculate ROI and understand which pages and keywords drive actual business results.
What are common mistakes when tracking SaaS SEO KPIs?
Common mistakes include tracking too many metrics, ignoring conversion data, and not aligning KPIs with business goals. Another frequent issue is focusing only on traffic without understanding user intent or quality.
Can small SaaS startups benefit from tracking SEO KPIs early?
Yes, early tracking helps startups build a strong foundation. Even with low traffic, monitoring impressions, rankings, and engagement reveals what’s working and where to focus limited resources for faster growth.
How do SEO KPIs differ across the SaaS funnel stages?
Top-of-funnel KPIs focus on impressions and traffic, middle-of-funnel KPIs include engagement and time on page, while bottom-of-funnel KPIs track conversions, activation, and revenue. Each stage requires different metrics to measure success effectively.
What tools are essential for tracking SaaS SEO KPIs?
The core tools include Google Search Console for visibility data, Google Analytics 4 for user behavior and conversions, and platforms like Ahrefs or SEMrush for keyword tracking and backlink analysis.